Reduce the number of times capacity growth is needed inside the StringWriter. A typical default SpringBoot Prometheus page has more than 11k characters. Best performance results when no capacity growth is needed at all, so base it on previous metrics page size plus some room for possible extra metric info.
Background
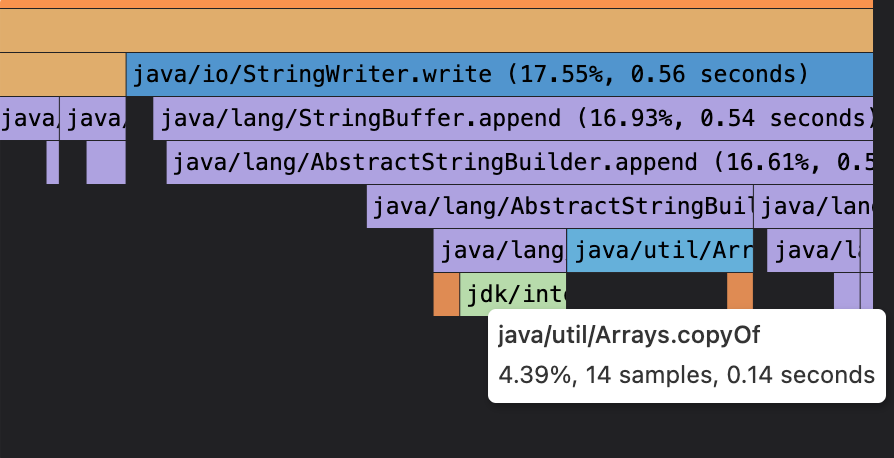
Profiling our SpringBoot application showed time spend in the StringWriter of PrometheusScrapeEndpoint, and below that some time spend in Arrays.copy of the wrapped StringBuilder.ensureCapacity. Default size is 16, so there will be multiple new array allocations and array copies during the filling of the StringWriter.
This is below TextFormat.writeOpenMetrics100:
A quick gain might be to pre size the StringWriter in PrometheusScrapeEndpoint.
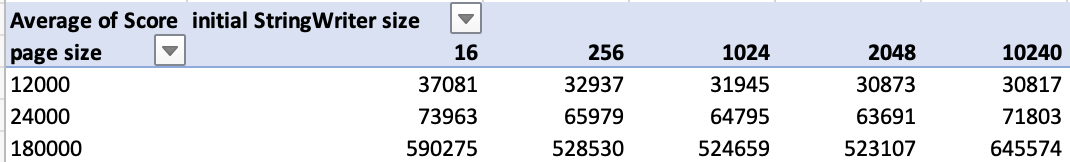
A JMH benchmark on local Mac M1 using StringWriter with different initial capacity show no substantial gain in ops/s. Effect might be different/better in virtualized container environment with less cpu power? The JMH benchmark does show significant memory allocation improvement if StringWriter is created with initial actual size + some: can be around 3 times less.
Bytes allocated per op, with different initial StringWriter sizes:
Bytes allocated with StringWriter page size + 2:
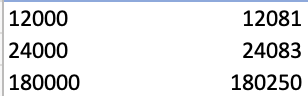
First tried with fixed 14 * 1024 size, but that turns out to make it possibly worse when metrics page is a bit bigger than that and dynamic increase of backing array is 'too large' (e.g. see last column in first table). So then introduced a previousMetricsScrapeSize to hold size of last scrape and make new StringWriter that size plus some more for possible new data.
Not sure about actual improvement, but gut feeling is: less memory allocation, less objects (arrays) created to be garbage collected, less copying of arrays, and a component that is running in many places on earth will save some.
Final note: A default Prometheus metrics page is about 11k-12k characters. Adding additional metrics, e.g. via micrometer, will increase the size. We found that we used MicrometerHttpClientInterceptor that would add one line of metric info for each unique url, so that made 800k+ pages and had this issue magnified in profiling.
Comment From: mhalbritter
Hey @stokpop, thanks for the PR!
I think the idea to remember the last scrape size is very nice. But i would not set the initial size (the one before the 1st scrape) to a fixed 12kb, instead we should use the defaults of the StringWriter in that case. Can you please update the PR? Thanks a lot!
Comment From: stokpop
@mhalbritter good idea, so that would be 16, the default size of StringWriter, I have made the update.
Comment From: mhalbritter
Merged, thanks a lot for the contribution!
Comment From: wilkinsona
@mhalbritter and I discussed this a bit and we've decided that the unnecessary allocations are a performance bug.