Spring Boot Version: 3.0.0 Example Project: https://github.com/kyle-copeland/exemplar-example
Steps to replicate
- Clone project https://github.com/kyle-copeland/exemplar-example
$ mvn spring-boot:run- Make sample requests to http://localhost:8080/hello
- Go to http://localhost:8080/actuator/prometheus
Expected result https://github.com/OpenObservability/OpenMetrics/blob/main/specification/OpenMetrics.md#exemplars-1
http_server_requests_seconds_bucket{error="none",exception="none",method="GET",outcome="SUCCESS",status="200",uri="/hello",le="0.006990506",} # {trace_id="KOO5S4vxi0o"} 0.67
Actual result
http_server_requests_seconds_bucket{error="none",exception="none",method="GET",outcome="SUCCESS",status="200",uri="/hello",le="0.006990506",}
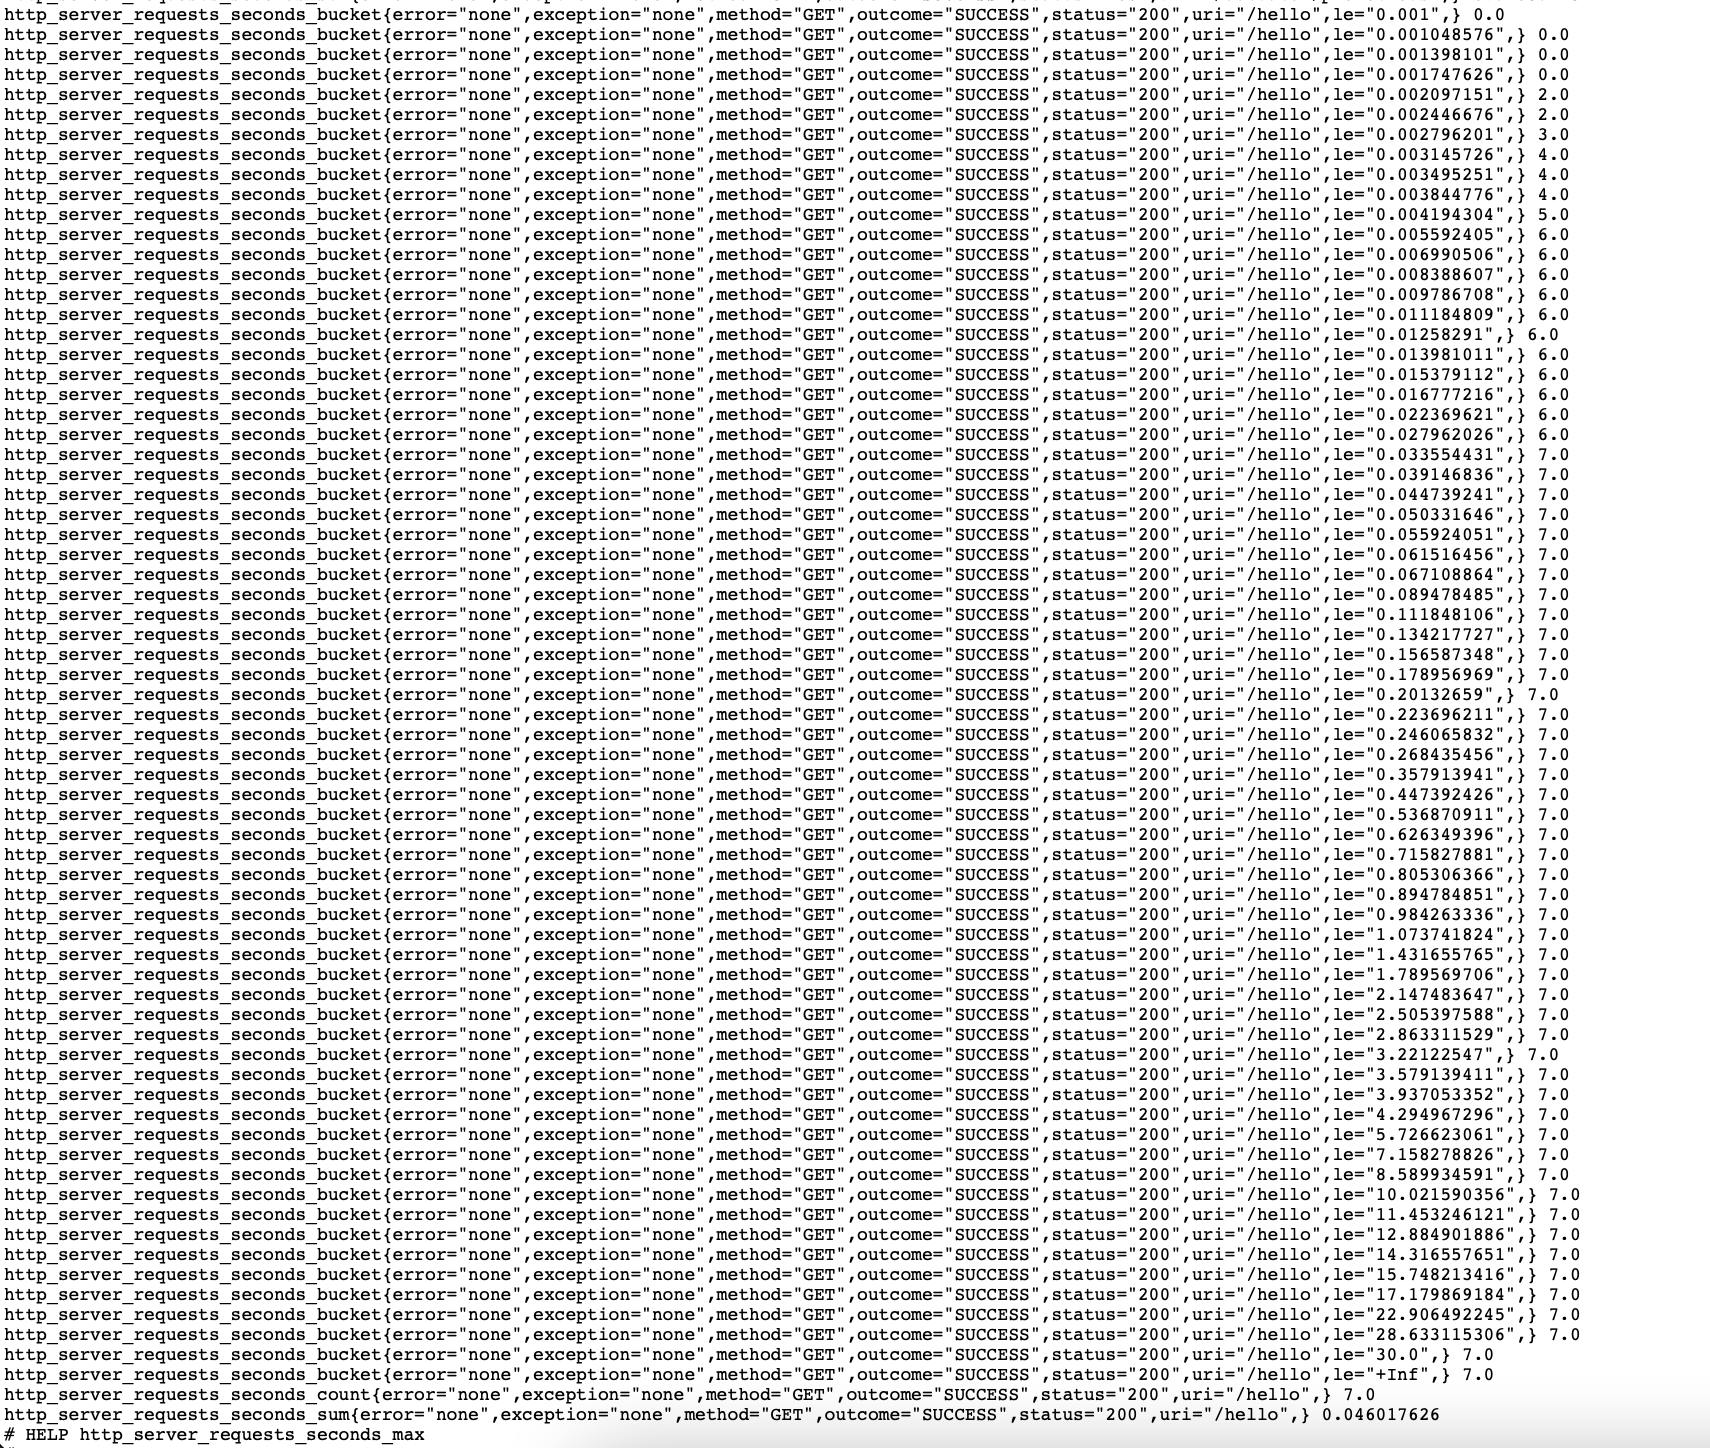
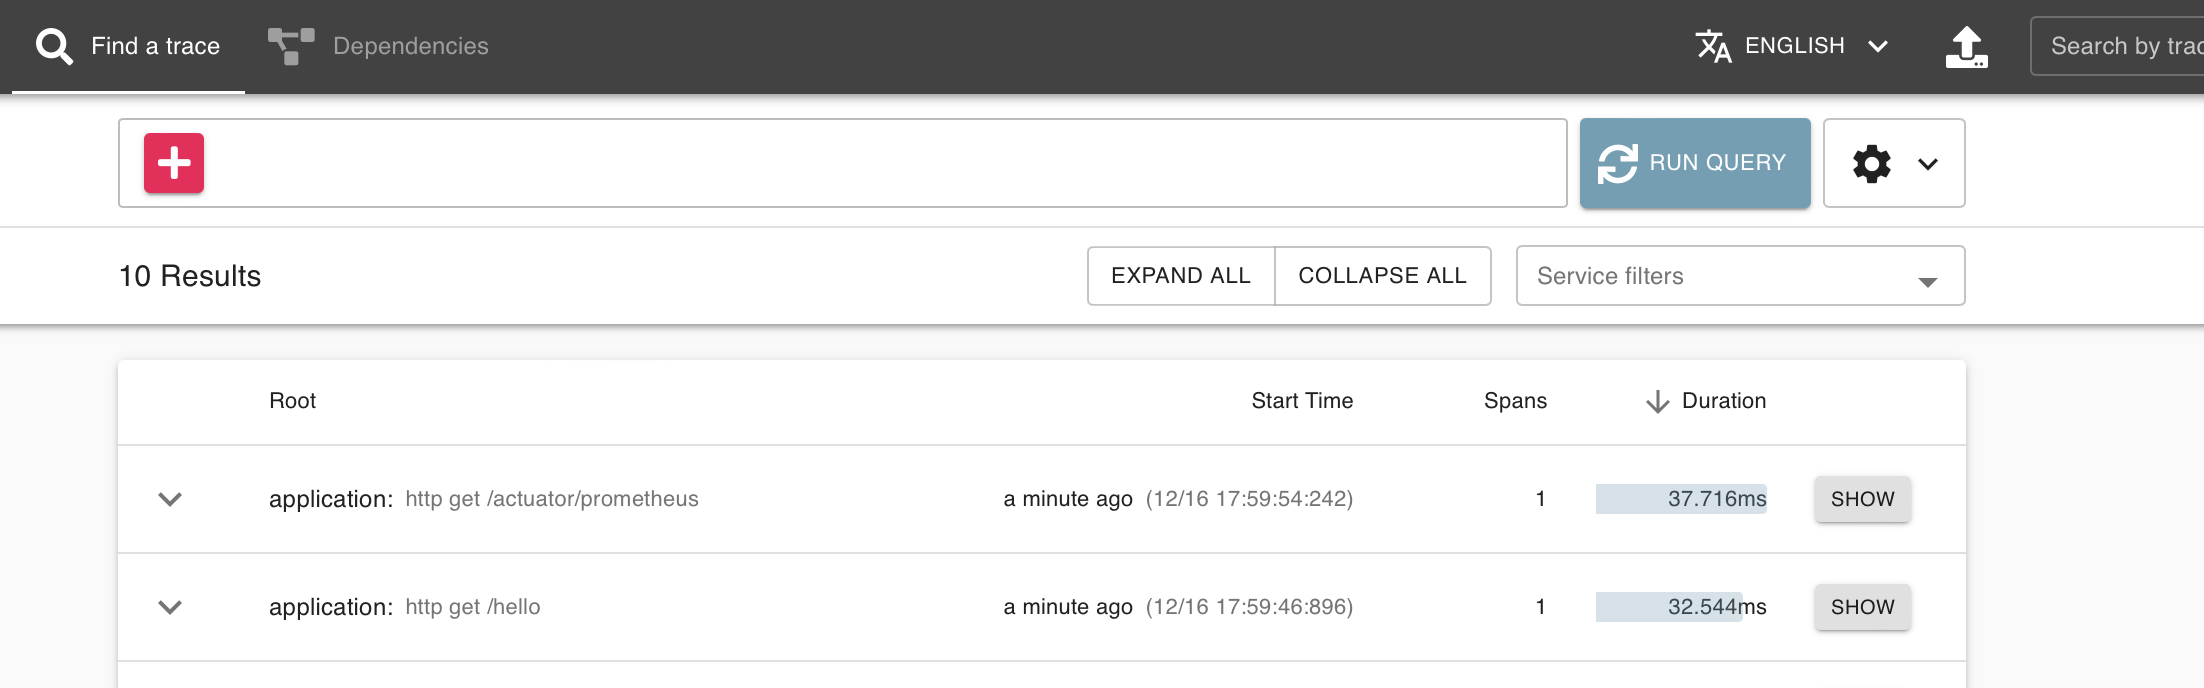
Traces appear correctly in Zipkin
Documentation: https://docs.spring.io/spring-boot/docs/3.0.0/reference/htmlsingle/#actuator.metrics.export.prometheus
Prometheus Exemplars are also supported. To enable this feature, a SpanContextSupplier bean should be present. If you use Micrometer Tracing, this will be auto-configured for you, but you can always create your own if you want. Please check the Prometheus Docs, since this feature needs to be explicitly enabled on Prometheus' side, and it is only supported using the OpenMetrics format.
Blog article: https://spring.io/blog/2022/10/12/observability-with-spring-boot-3 When copying the example project from this article, I experience the same issue.
Unkowns
I'm unsure how to tell if the SpanContextSupplier bean has been auto-configured correctly
I'm unsure if I'm missing some configuration
I'm unsure if I'm not understanding when traceID will be appended to prometheus metrics
Comment From: izeye
@kyle-copeland If you provide a proper Accept header, you can see the following output with your sample:
% curl -s 'http://localhost:8080/actuator/prometheus' -i -X GET -H 'Accept: application/openmetrics-text; version=1.0.0; charset=utf-8' | grep "trace_id"
http_server_requests_seconds_bucket{error="none",exception="none",method="GET",outcome="SUCCESS",status="200",uri="/hello",le="0.022369621"} 1.0 # {span_id="eaa16ebd64f74560",trace_id="63a315ee4ecc7ee9eaa16ebd64f74560"} 0.018786042 1671632366.681
%
Comment From: wilkinsona
Thanks, @izeye.