We use a mix of Servlet and Webflux spring applications. In Spring Boot 3.0 there are differences in how traces are logged and how they are actually recorded on the tracing backend. The logging differences makes it especially difficult to use tools like Grafana and associate trace IDs from Loki since the position of that trace ID seems to move depending on the app type.
I have created a simple sample to reproduce this issue here: https://github.com/braunsonm/spring-inconsistency-sample. In this sample the two applications are identical except one is servlet and the other is webflux. The sample endpoint uses a RestTemplate and WebClient respectively to call https://google.com to generate a simple external source in our traces. This was generated using https://start.spring.io on Spring Boot 3.0
I'll go through the differences now:
Logging
In Servlet, you must use logging.pattern.level as described in the docs to include the trace and span IDs in your logs. I am using %5p [${spring.application.name:},%X{traceId:-},%X{spanId:-}] as recommended from the docs. This creates a log like so:
2022-12-08T14:31:33.019 DEBUG [,59da07ccc24890648d97903cc81dcf6b,2d70739e9632e97f] 41859 --- [nio-8888-exec-1] o.s.web.servlet.DispatcherServlet : Completed 200 OK
However in Webflux, you are unable to get your trace and span IDs even with the recommended setting. You get a log line like so:
2022-12-08T15:02:10.916 DEBUG [,,] 49485 --- [or-http-epoll-3] o.s.w.s.adapter.HttpWebHandlerAdapter : [3b1900d8-1] Completed 200 OK
Notice how neither the trace nor the span are set in the log line. However it still does upload the span to the tracing backend.
Traces
The trace that is uploaded in Servlet looks how you would expect, a single trace with multiple spans.
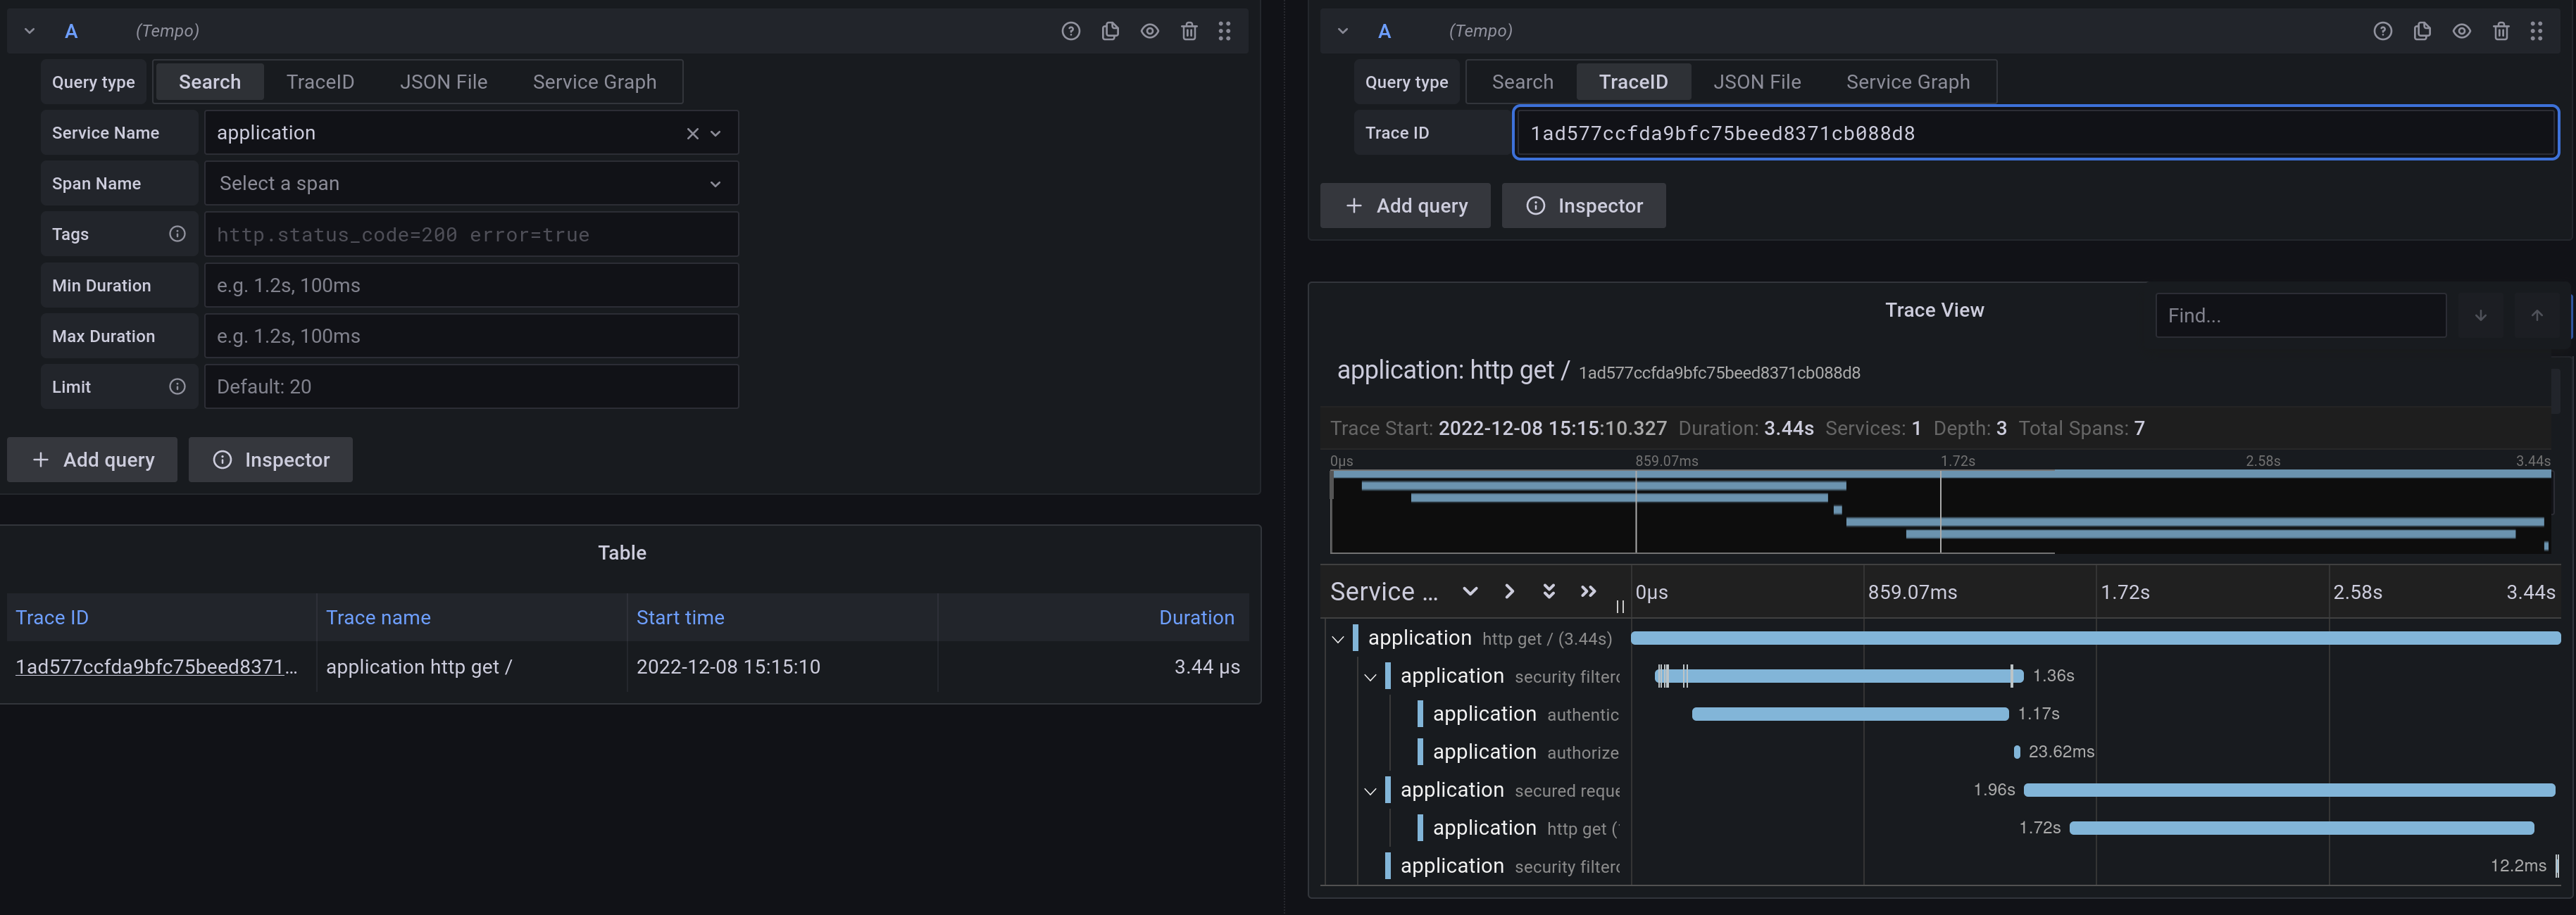
In Webflux, multiple traces are submitted for the same request, when only separate spans should be created. This makes the correlation unusable as you can't tell which trace for the security filters is actually part of the request you are looking for.
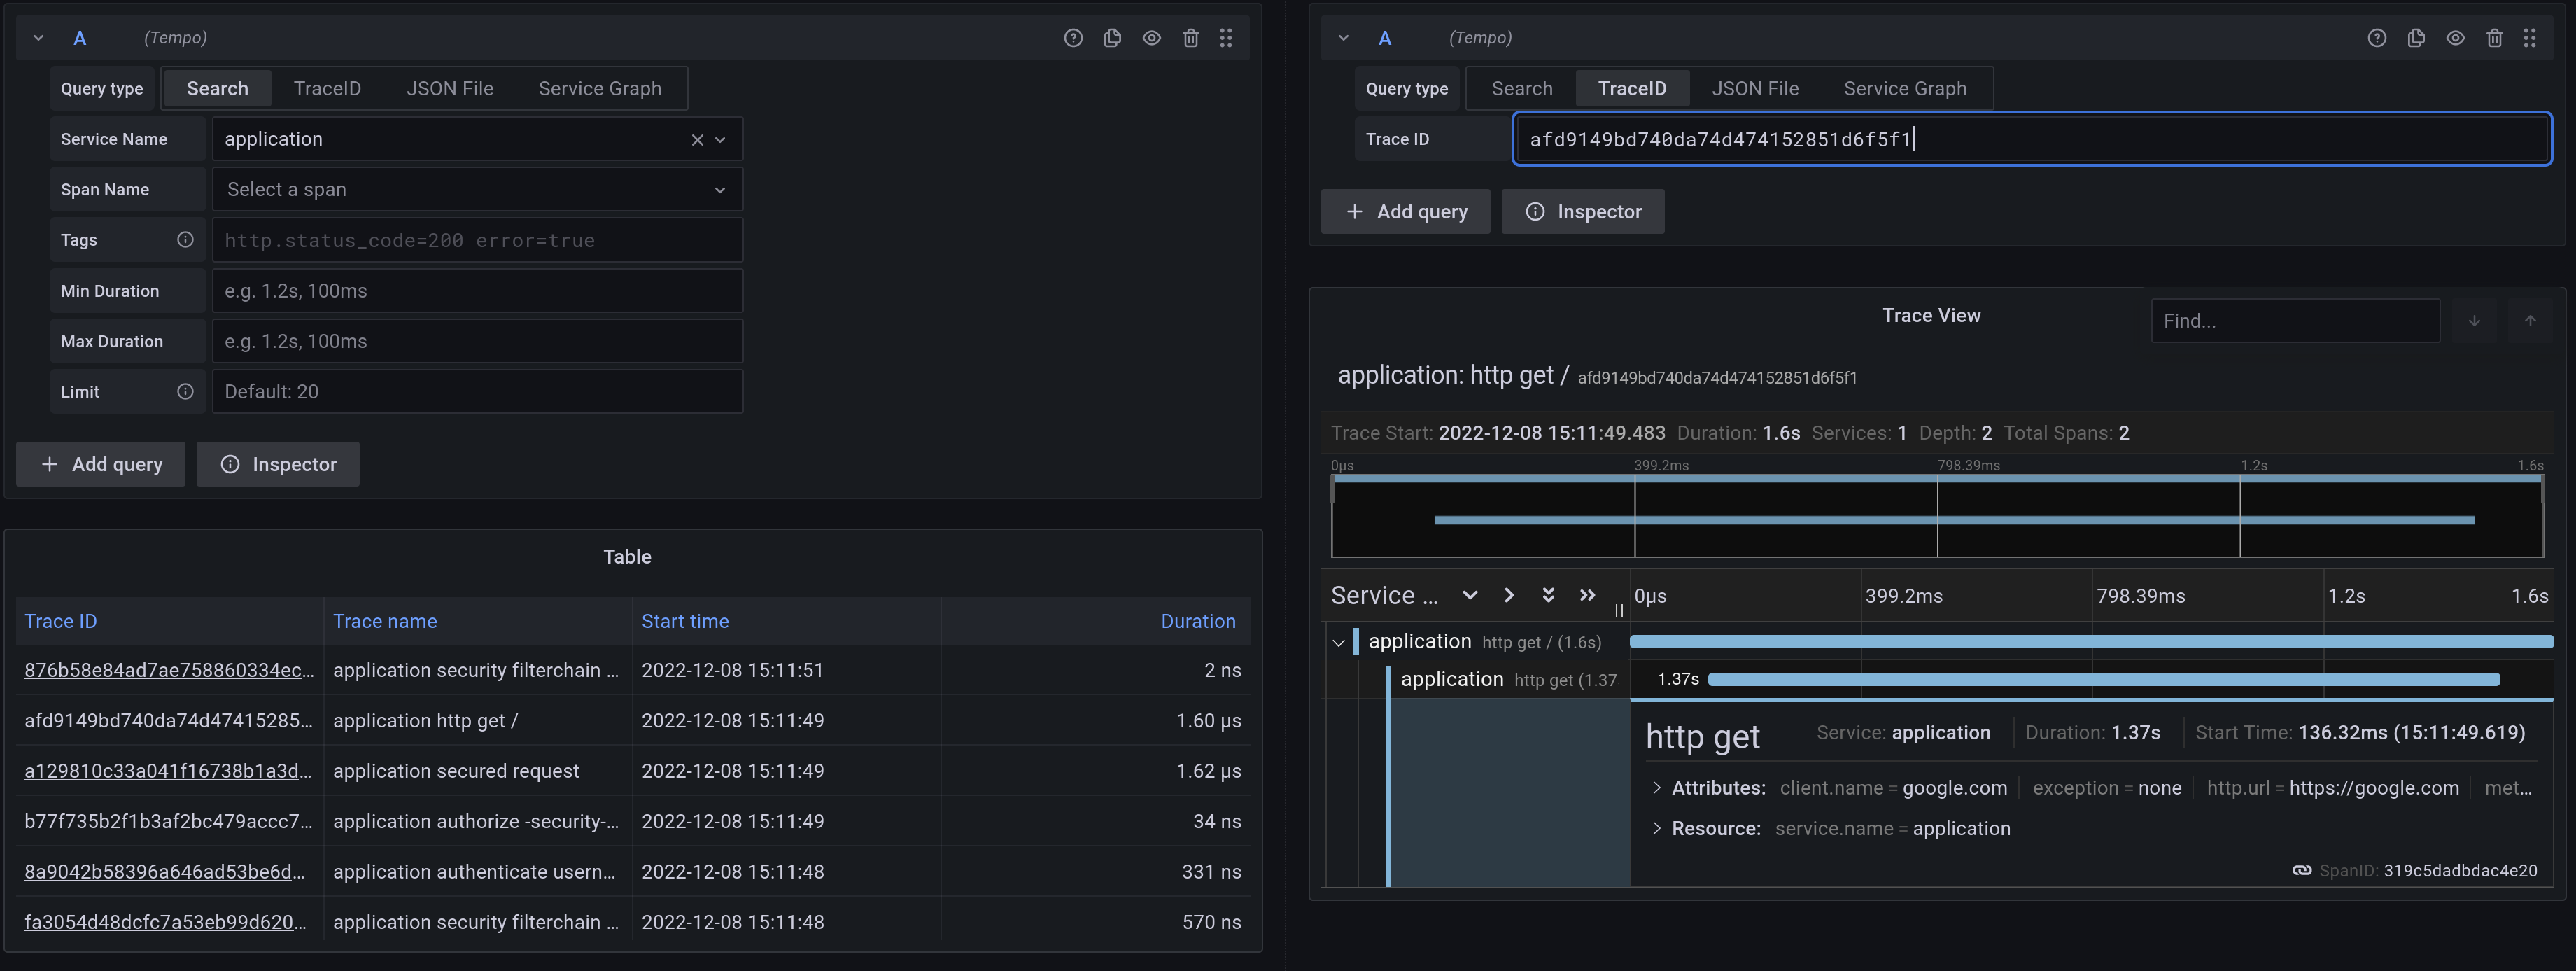
(This is just 1 REST call)
Comment From: bclozel
Thanks for the details report @braunsonm
I think the logging section of this issue is a duplicate of #33372, see the discussion there. We're aware that the situation is different from what Sleuth did, but there are many things to consider, especially performance. See https://github.com/spring-projects/spring-boot/issues/33372#issuecomment-1331385532 and reactor/reactor-core#3149.
As for the Traces part, I think that this is due to two things:
- first, the WebFlux observation filter is not currently configured with a particular order, this will be fixed in #33444
- second, I'm wondering if Spring's Security
ObservationWebFilterChainDecoratorshould get the parent observation before starting its own? Ideally, the WebFlux observation filter should be first in line, starting an observation for the entire request handling and the security one should get that observation from the Context view and use it as a parent. What do you think @marcingrzejszczak @jzheaux ?
As a first step @braunsonm, could you try creating the following bean and see how things behave in your sample application? This would replicate the fix to come with #33444.
@Bean
@Order(Ordered.HIGHEST_PRECEDENCE)
public ServerHttpObservationFilter webfluxObservationFilter(ObservationRegistry registry) {
    return new ServerHttpObservationFilter(registry);
}
Comment From: braunsonm
@bclozel Adding the ServerHttpObservationFilter seems to have no effect on the trace output. Here is with the bean added:
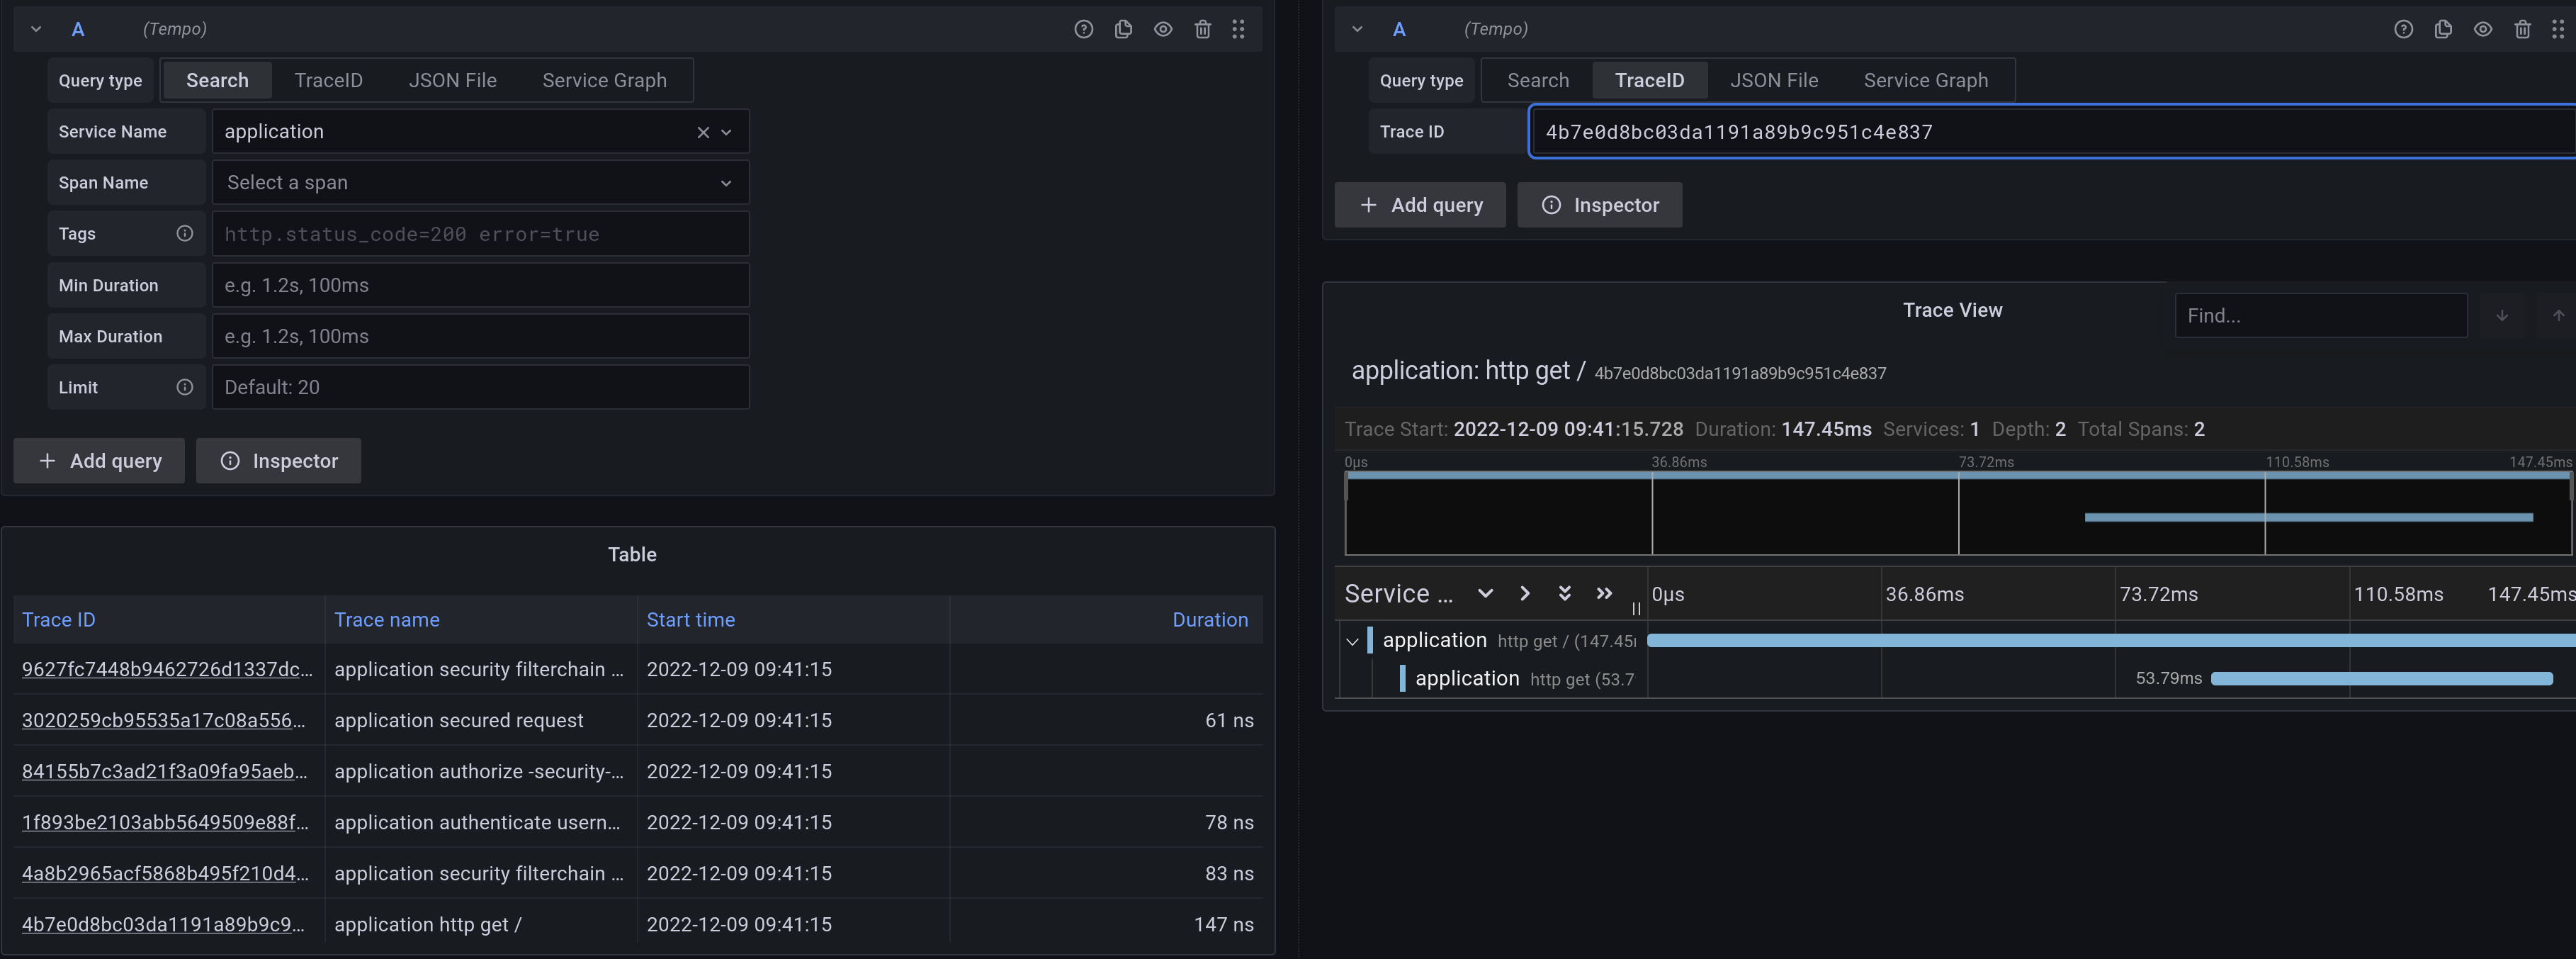
I haven't had much luck getting the trace and span to appear in the logs like discussed at #33372 and I share the concerns that this would require invasive code changes in our codebases. The solutions provided are able to add context around specific sections of the reactor pipeline but it does not solve the areas I posted above which come from Spring itself, like the logging that occurs when going through the security filter chain, I would expect those to log with the trace ID not only my own logging.
Comment From: jzheaux
@bclozel I will try out the sample with Spring Security looking up the parent observation and report back.
Comment From: belovaf
I have exactly the same issue with webflux applications. All spring security spans are uncorrelated and have different trace ids.
Comment From: belovaf
@jzheaux
After some research I found causes and propose a solution:
1) Both ObservationAuthenticationManager and ObservationReactiveAuthorizationManager create observation without parent. We can wrap their methods with Mono.deferContextual() and manually set parent from context by key ObservationThreadLocalAccessor.KEY.
2) ObservationWebFilterChainDecorator creates all observations without parent. We can apply same fix here.
I tested locally these fixes and all work fine.
Comment From: janchristian-haddorp
Just to add here... The issue of "not connected traces" can be easily reproduced with a simple Spring Boot / Spring Security application (as shown in #33719).
Looking forward to an update and/or fix.
Comment From: bclozel
Thanks for the analysis @belovaf ! I'm closing this issue in favor of spring-projects/spring-security#12524