Goal here is to document the cache misses on those 3 tasks:
- :spring-boot-project:spring-boot-docs:asciidoctor
- :spring-boot-project:spring-boot-docs:asciidoctorMultipage
- :spring-boot-project:spring-boot-docs:asciidoctorPdf
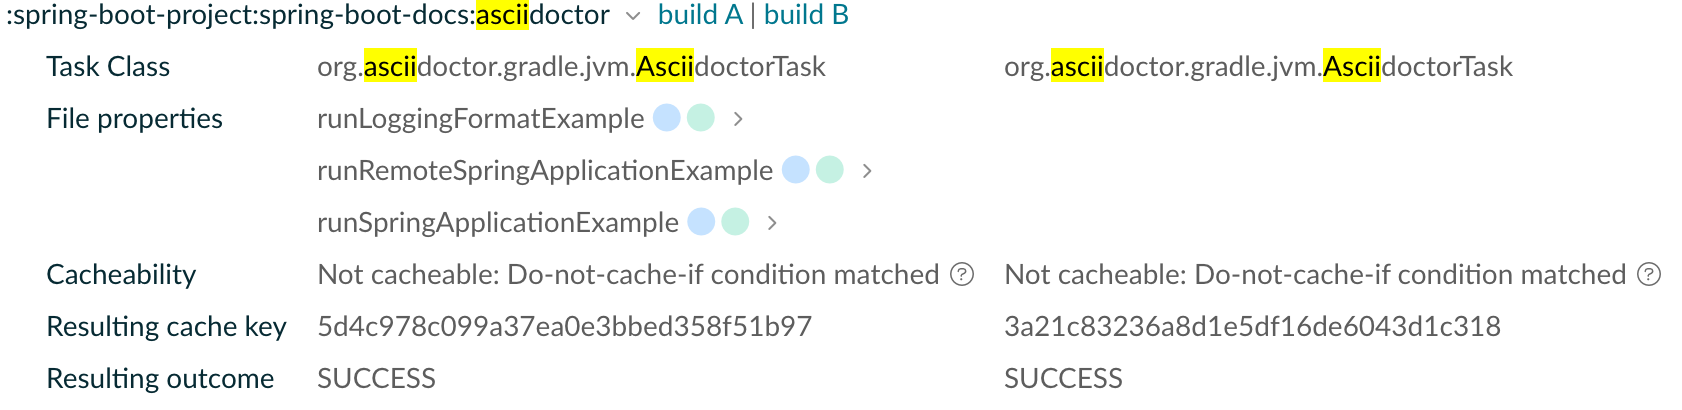
the 3 task inputs runRemoteSpringApplicationExample, runSpringApplicationExample, runLoggingFormatExample are log files containing timestamps, pid and absolute path, for example:
2023-02-14T15:54:42.600+01:00 INFO 61537 --- [ main] o.s.b.devtools.RemoteSpringApplication : Starting RemoteSpringApplication v3.1.0-SNAPSHOT using Java 17.0.1 with PID 61537 (/Users/myuser/.m2/repository/org/springframework/boot/spring-boot-devtools/3.1.0-SNAPSHOT/spring-boot-devtools-3.1.0-SNAPSHOT.jar started by myuser in /opt/apps/)
We could consider changing the log pattern with logging.pattern.console to day precision and disable logging on o.s.b.devtools to get a cache hit, but I assume that those outputs are part of the documentation and you want the default format / output to be displayed.
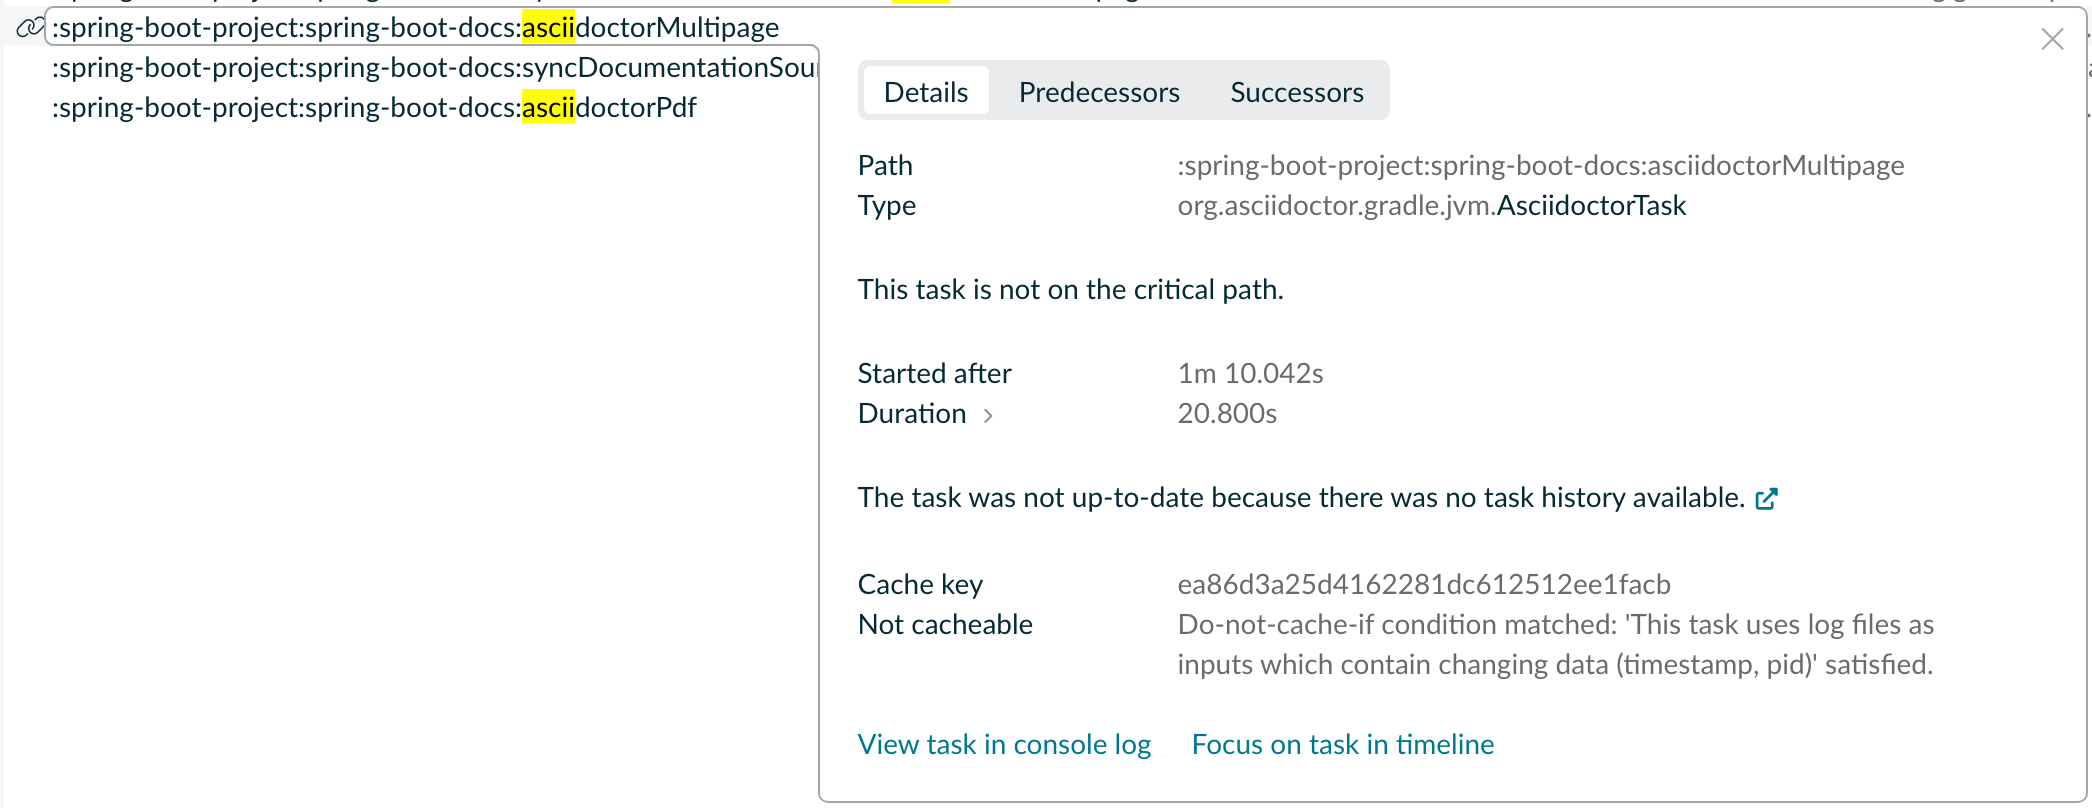
In my experience the cost of having those re-running was significant: 2m 31.896s of CPU time.
This is the outcome with the cache miss documented in Gradle Enterprise:
In addition to that, naming the inputs make the troubleshooting easier in Gradle Enterprise, this is what you can get instead of anonymous $1, $2, $3:
Comment From: wilkinsona
Thanks very much, @jprinet.