Spring Boot version: 3.1.2 Java version: 17.0.3, vendor: Eclipse Adoptium
Executing a spring-boot testsuite a java.lang.OutOfMemoryError is thrown after some time.
The testsuite is executed via maven-surefire-plugin:
<plugin>
    <groupId>org.apache.maven.plugins</groupId>
    <artifactId>maven-surefire-plugin</artifactId>
    <version>3.1.2</version>
    <configuration>
        <forkCount>1</forkCount>
        <argLine>-Xmx2g -XX:+HeapDumpOnOutOfMemoryError --add-opens java.base/java.lang=ALL-UNNAMED</argLine>
    </configuration>
</plugin>
The test context caching has been limited to 1 by creating a spring.properties file with the following content:
spring.test.context.cache.maxSize=1
It has been verified that above setting takes effect by enabling DEBUG logging for org.springframework.test.context.cache.
From the above setup I would expect that only the last used application context is cached and all other application contexts become eligible for garbage collection.
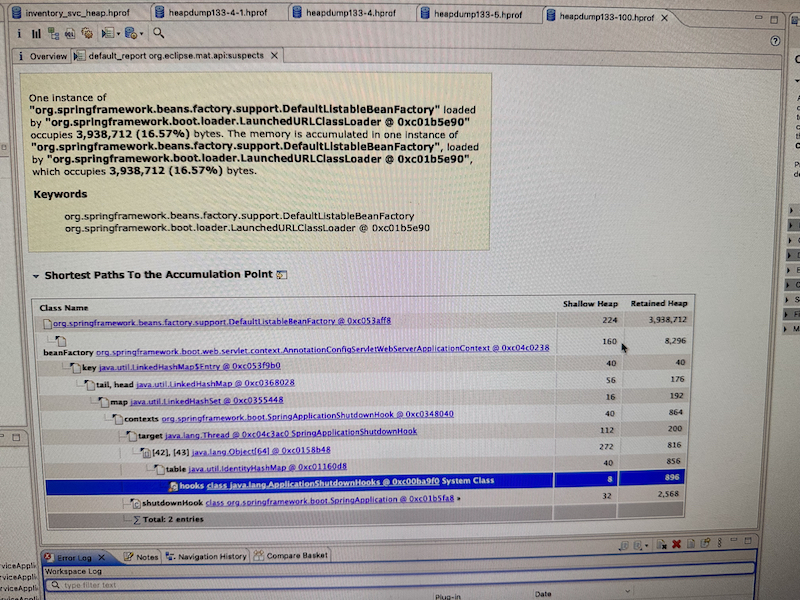
However, when examining the heap dump that is created when the java.lang.OutOfMemoryError is thrown (compare -XX:+HeapDumpOnOutOfMemoryError setting above) I see that SpringApplicationShutdownHook#closedContexts contains 36 entries retaining around 1.6 GB of heap space. When analyzing the path to GC roots using Eclipse MAT for the application contexts contained in this Map then the only path to a GC root goes through the WeakHashMap$Entry holding the respective application context. When instructing Eclipse MAT to show paths to GC roots excluding weak references no paths are output.
Given that a full GC should happen before a java.lang.OutOfMemoryError is thrown it seems like something is blocking the GC of application contexts in SpringApplicationShutdownHook#closedContexts.
I can probably provide the heap dump if required (would need to check, though).
Comment From: bclozel
While this issue occurs while running tests, I think this is a duplicate of #37096 We will reopen it if it turns out the use case is different. @Mobe91 please subscribe to the other issue so that you can confirm when the fix is in. Thanks!
Comment From: Mobe91
@bclozel
I'd like to re-open this issue because the workaround described in for #37096 (logging.register-shutdown-hook=false) does not solve this. I verified by debugging that no shutdown hook is registered in org.springframework.boot.context.logging.LoggingApplicationListener#registerShutdownHookIfNecessary. Yet, the same java.lang.OutOfMemoryError can be observed as described initially. Therefore I think this is a different issue.
I can see that the ApplicationContext is registered with the shutdown hook in org.springframework.boot.SpringApplication#refreshContext.
Comment From: wilkinsona
@Mobe91 Can you please provide a minimal sample that reproduces the leak?
Comment From: Mobe91
@wilkinsona I could try but I think it would take quite some effort. Do you think it would make sense for you to first look at the dump? Maybe you spot something quickly that I couldn't...
Comment From: wilkinsona
We could try that, but from what you've described about the heap dump, it doesn't sound like it's going to help as it isn't showing what's preventing GC of the closed contexts.
Another workaround that you could try would be to run your tests with spring.main.register-shutdown-hook set to false.
Comment From: Mobe91
Another workaround that you could try would be to run your tests with spring.main.register-shutdown-hook set to false.
I've tried this and it seems to shift the issue to org.springframework.boot.actuate.autoconfigure.endpoint.condition.OnAvailableEndpointCondition#enabledByDefaultCache where instances of org.springframework.boot.web.servlet.context.ApplicationServletEnvironment keep piling up which also doesn't make sense because it's a ConcurrentReferenceHashMap... Eclipse MAT again reports no paths to GC roots excluding weak/soft references for these objects.
I guess I'll start constructing a fresh spring boot application and try to re-produce this somehow then. Of course, grateful for any tips or hints.
Comment From: spring-projects-issues
If you would like us to look at this issue, please provide the requested information. If the information is not provided within the next 7 days this issue will be closed.
Comment From: Mobe91
I am closing this issue for now since I currently don't have time to create a reproducer. I will reopen or reply if I either have a reproducer or found the root cause of my issue.
Comment From: wilkinsona
Thanks, @Mobe91. Please do let us know if you manage to make some progress.
Comment From: awhig
I'm seeing a potential memory leak issue as well. I stripped down my service, so that the controller does nothing but return 200 OK. After 20 minutes of load testing (1 user), memory usage goes from 291Mb to 314MB. Leak report also mentions SpringApplicationShutdownHook. Spring Boot 3.1.4
Comment From: wilkinsona
@awhig That seems to be unrelated to this issue which was specifically about test suite execution.
FWIW, a BeanFactory instance holding 4MB in memory doesn't seem too large as the bean factory references every bean in your application. If you can create a reproducer for your potential memory leak, please open a new issue and we will take a look.