Hi,
I got the OOM every few days after I restart the project. Please check the details as below. Thanks for your help!
Environment: JDK: 17 SpringBoot: 3.1.2 SpringCloud: 2022.0.3 spring-boot-starter-actuator: 3.1.2 micrometer-registry-prometheus: 1.11.2
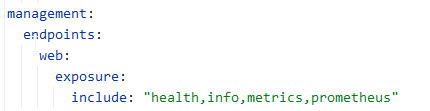
Management endpoints config:
OutOfMemory Error: java.lang.OutOfMemoryError: Java heap space at java.base/java.util.Arrays.copyOf(Arrays.java:3537) ~[na:na] at java.base/java.lang.AbstractStringBuilder.ensureCapacityInternal(AbstractStringBuilder.java:228) ~[na:na] at java.base/java.lang.AbstractStringBuilder.append(AbstractStringBuilder.java:582) ~[na:na] at java.base/java.lang.StringBuffer.append(StringBuffer.java:313) ~[na:na] at java.base/java.io.StringWriter.write(StringWriter.java:106) ~[na:na] at io.prometheus.client.exporter.common.TextFormat.writeOpenMetrics100(TextFormat.java:233) ~[simpleclient_common-0.16.0.jar!/:na] at org.springframework.boot.actuate.metrics.export.prometheus.TextOutputFormat$2.write(TextOutputFormat.java:62) ~[spring-boot-actuator-3.1.2.jar!/:3.1.2] at org.springframework.boot.actuate.metrics.export.prometheus.PrometheusScrapeEndpoint.scrape(PrometheusScrapeEndpoint.java:62) ~[spring-boot-actuator-3.1.2.jar!/:3.1.2]
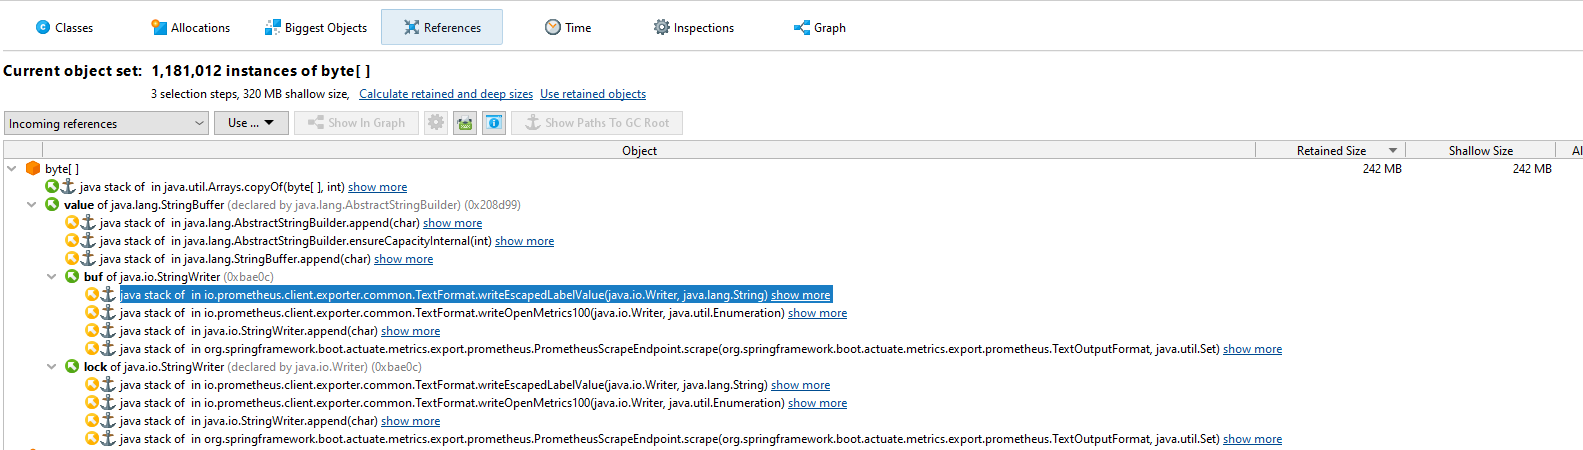
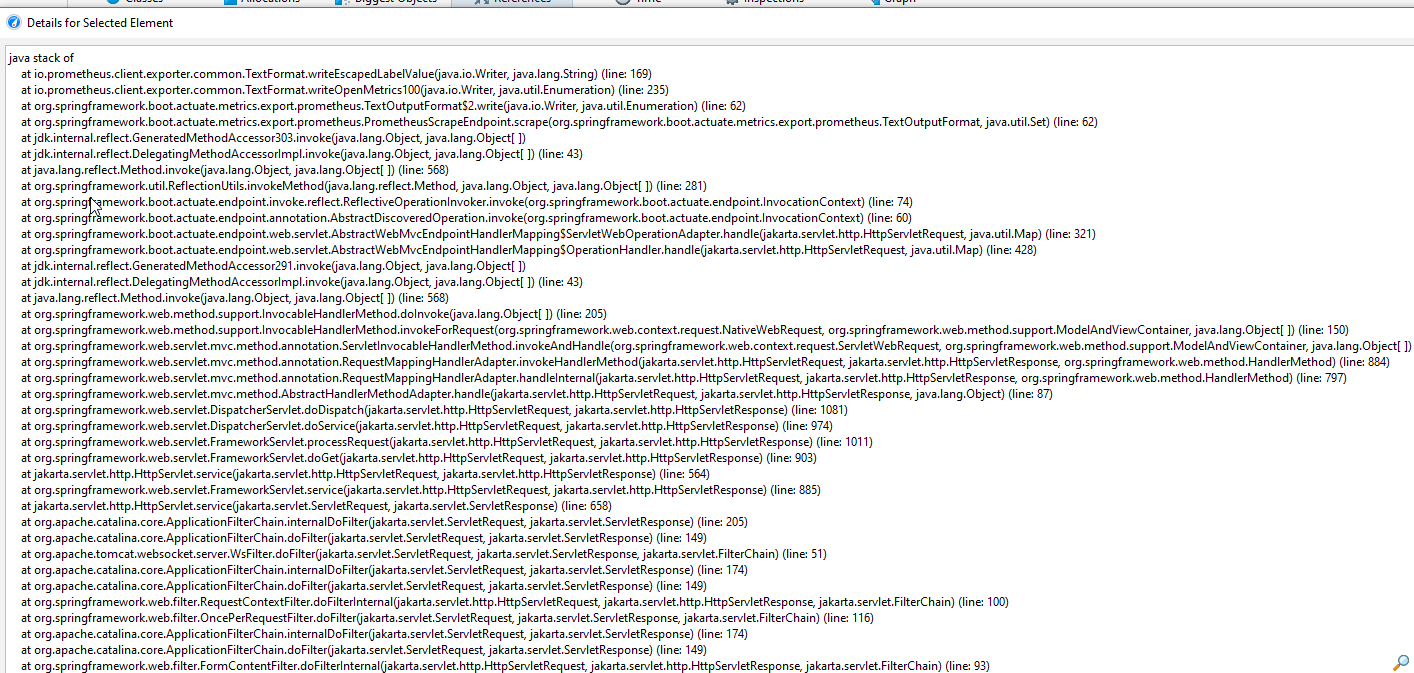
Heapdump Analysis:
Comment From: wilkinsona
Thanks for the report. Unfortunately, the information you have provided isn't sufficient to identify the problem. It tells us is that there wasn't enough memory available to create the response from the Prometheus endpoint but it does not tell us why there wasn't enough memory. The problem could be completely unrelated to Prometheus.
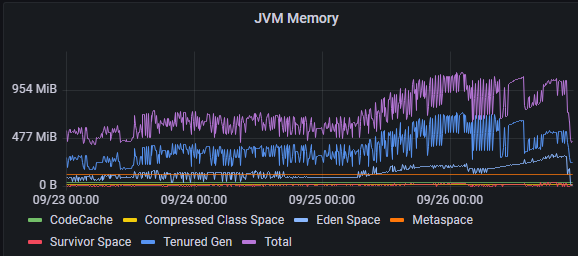
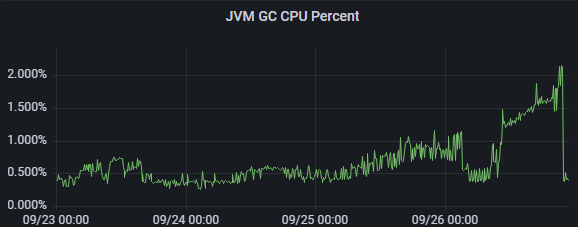
The Tenured Gen and GC CPU were keep rising unusually
This sounds like a memory leak but it could be anywhere in your application. You should be able to identify the leak by comparing multiple heap dumps and identifying growth in the heap that should not be occurring.
Unfortunately, we don't have the time to help with general diagnosis of a memory leak so I'm going to close this issue as there's no evidence of it being caused by Spring Boot. If your problem diagnosis reveals that it is caused by Spring Boot, please comment again on this issue with that diagnosis and we will re-open it and take another look.